


原创 舒涛 华西医院耳鼻喉科
阅读最新文献,紧跟前沿进展,这是一名研究者必须具备的习惯和要求。我们华西医院耳鼻咽喉头颈外科的硕士、博士研究生和博士后们自2019年以来,每周开展一次文献泛读和文献精读分享会,至今已累计开展了200多次。2023年9月13日开始,本科室陆续将其进行整理,同步推出在线前沿速递和文献解读板块。通过这种学习和分享的方式,使汇报者和大家都能对近期权威期刊发表的高质量研究有所了解,同时也是学习其他优秀研究者思路、方法和理论的良好手段。希望通过这种形式,把科内的分享扩大到所有的读者,一起学习,共同进步!
华西医院耳鼻咽喉头颈外科

精读分享│【Nature genetics】:利用多模态证据在性状相关位点优先筛选效应基因
英文题目:Prioritizing effector genes at trait-associated loci using multimodal evidence
中文题目:利用多模态证据在性状相关位点优先筛选效应基因
期刊:Nature genetics(IF: 31.7)
单位:复杂性状遗传学系,神经遗传学和认知研究中心,阿姆斯特丹神经科学,阿姆斯特丹自由大学,荷兰阿姆斯特丹
发表时间:2025年2月


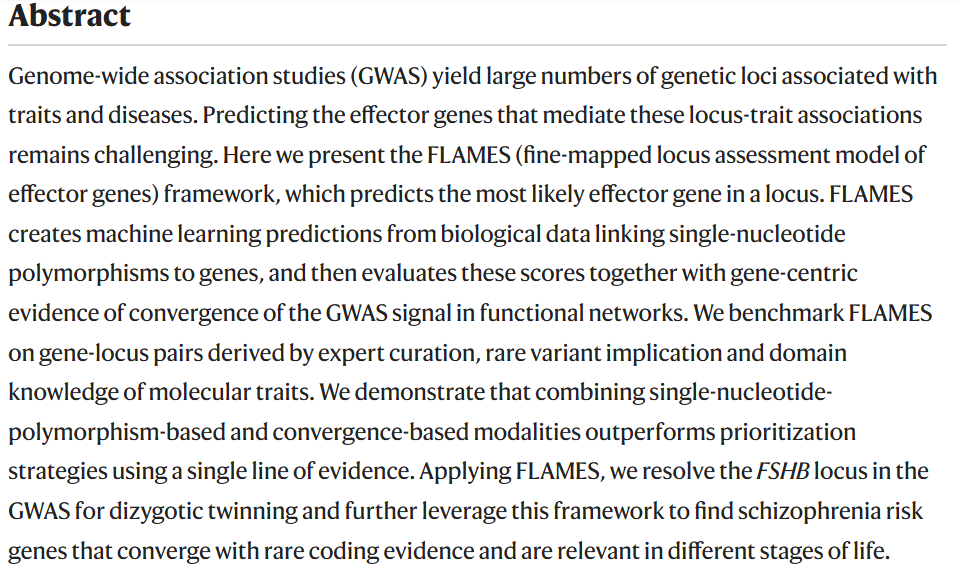
摘要:
全基因组关联研究(GWAS)揭示了与性状和疾病相关的大量遗传位点。然而,预测这些位点与性状关联的效应基因仍然是一个挑战。在这里,本研究提出了FLAMES(效应基因的精细定位评估模型)框架,用于预测一个位点中最可能的效应基因。FLAMES通过从单核苷酸多态性(SNP)与基因之间的生物学数据中生成机器学习预测,并结合基因中心的证据,评估GWAS信号在功能网络中的收敛性。本研究通过专家策划的基因-位点对、罕见变异的证据以及分子性状的领域知识对FLAMES进行了基准测试。本研究证明,将基于单核苷酸多态性的方法与基于收敛性的方法结合起来,比仅使用单一证据的优先级策略表现更好。通过应用FLAMES,本研究解析了双卵双胞胎GWAS中的FSHB位点,并进一步利用这一框架发现了与罕见编码证据收敛的与精神分裂症风险相关的基因,这些基因在生命的各个阶段都具有相关性。
研究思路及方法:
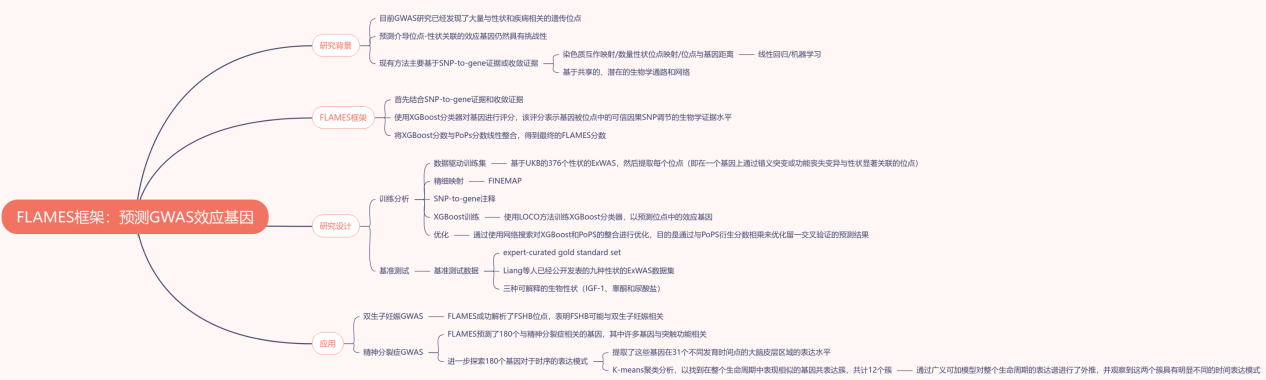
主要结果:
1.结合单核苷酸多态性与基因的关联以及基于收敛的证据的FLAMES
本研究创建了一个名为FLAMES的综合性框架,该框架结合了单核苷酸多态性(SNP)与基因的关联证据以及基于汇聚的证据,为每个基因输出一个单一的分数(Figure 1)。总结来说,对于每个位点,该框架标注精细映射的可信集合,并使用机器学习分类器为每个基因打分,其中该分数表示该基因受该位点一组可信因果SNP调控的生物学证据水平。FLAMES所使用的所有注释的概览可在表1中找到,更详细的注释在补充表1中。用于生成SNP与基因分数的XGBoost分类器是在一组包含预测的无功能(pLoF)变异或与相应性状相关的错义变异的GWAS位点上进行训练的,这些变异在ExWAS中被暗示与基因相关。随后,XGBoost分数与基于汇聚的多基因优先分数(PoPS)相结合。简而言之,XGBoost分数与缩放后的PoPS相乘,使得XGBoost分数对于PoPS较低的基因降低。此外,考虑到在位点中具有最高PoPS仍具有预测价值,相应基因的XGBoost分数会进一步提高。这导致每个精细映射的GWAS信号在区域内的每个基因都有一个单一的FLAMES分数。FLAMES框架的基本假设是,对于每个不是由于人群分层或其他形式混杂因素导致的SNP与表型之间的真正GWAS关联,存在一个最强烈介导SNP对表型影响的单一基因。本研究将介导SNP对表型影响的基因称为该SNP的效应基因。因此,每个位点中的每个可信集合都应该有一个效应基因。一个基因的FLAMES分数表示与其他GWAS暗示的基因的功能汇聚证据以及将基因与精细映射位点中的SNP联系起来的生物学研究证据的综合。
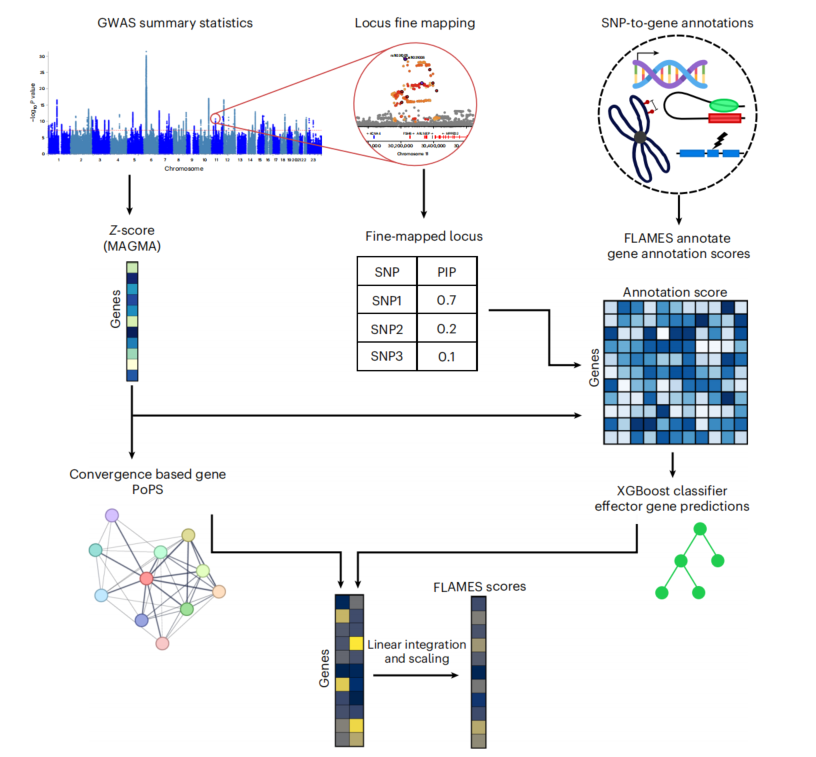
Figure 1. Overview of the FLAMES framework
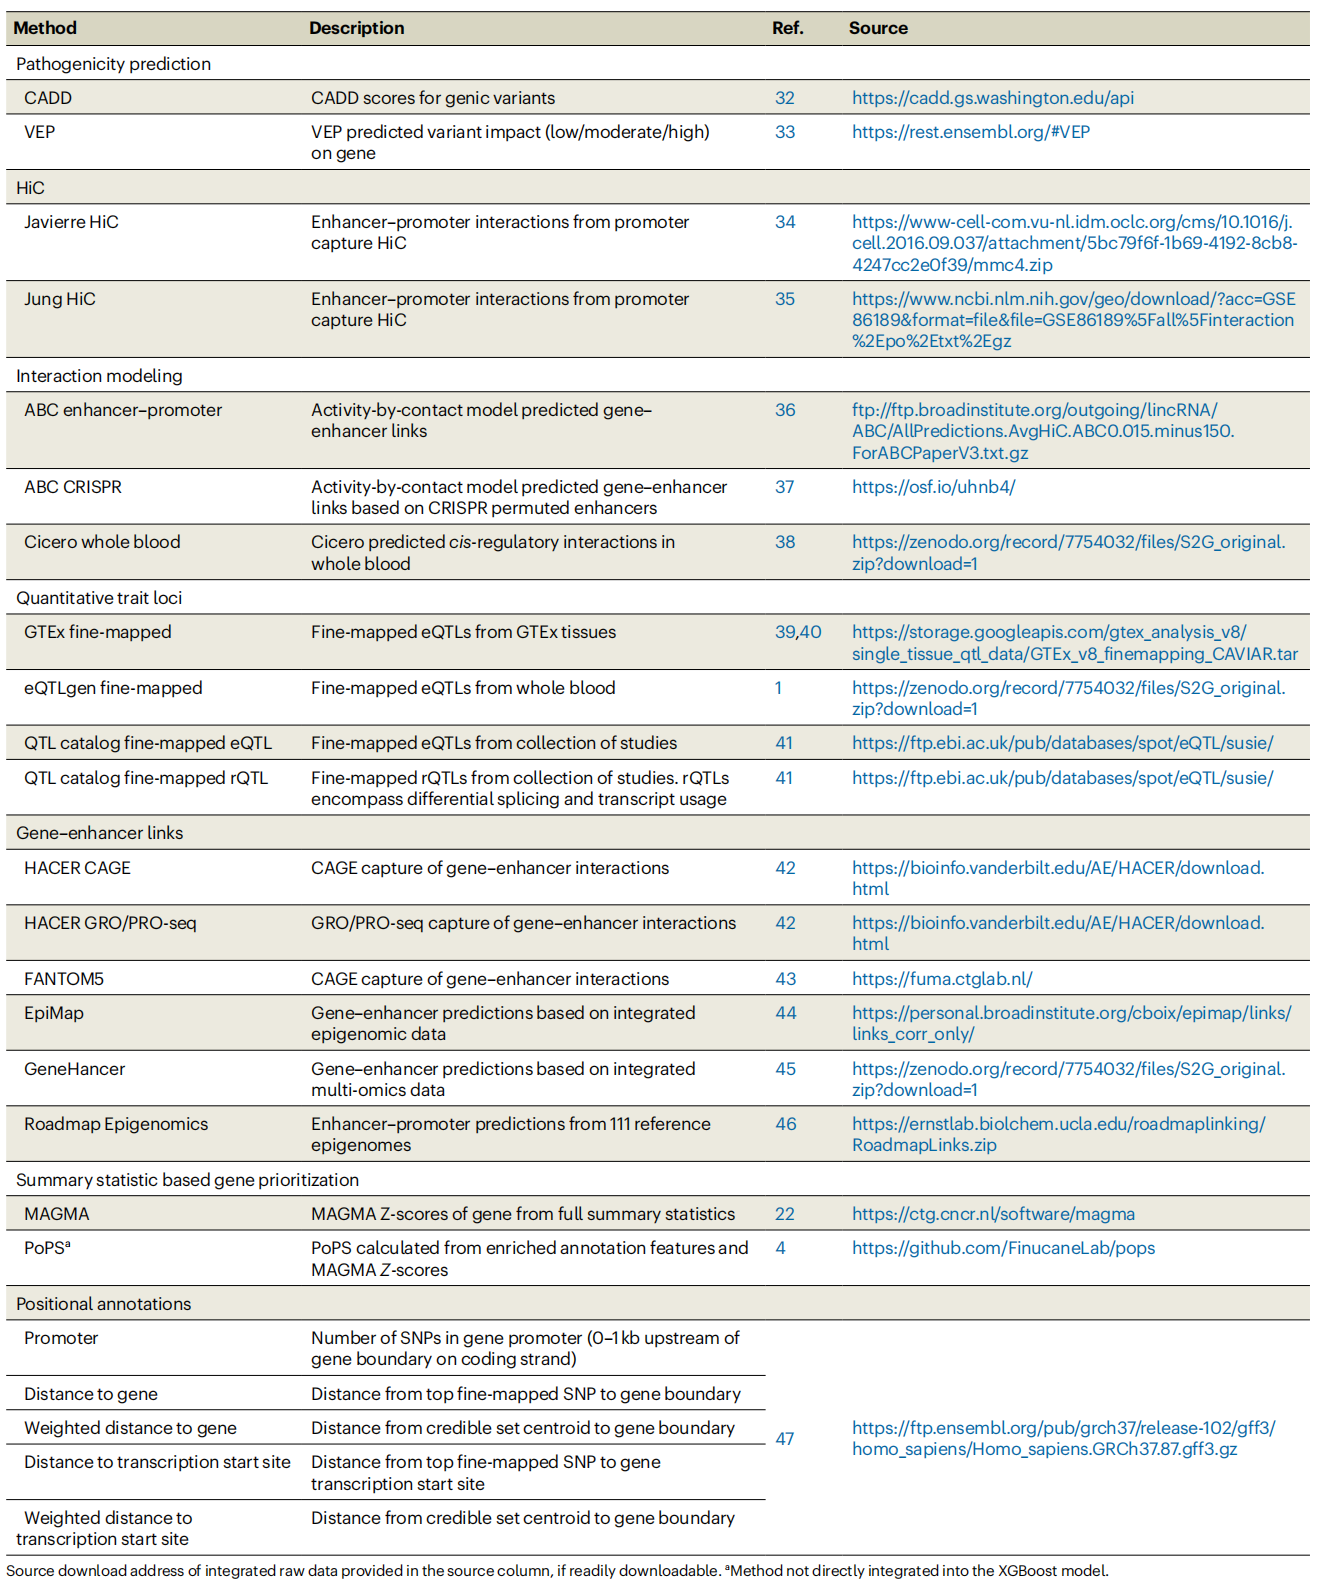 Table 1. SNP-to-gene annotations integrated in FLAMES
2.在ExWAS基因上训练FLAMES可避免人工整理的偏差
在创建一个基于SNP与基因注释来优先排序基因的模型时,用于训练模型的真实数据应尽可能接近实际生物学情况,以正确模拟SNP在位点中的影响。因此,采用无偏的数据驱动方法来训练模型应能实现最高的泛化能力。为了验证这一假设,本研究创建了一个数据驱动的训练集,并在该训练集上训练了FLAMES,同时在多个数据集上对FLAMES与其他基因优先级排序方法进行了基准测试(Figure 2)。这个数据驱动的训练集是通过分析英国生物样本库(UKBB)中的376个可遗传性状创建的,提取了每个位点,这些位点中有一个基因也通过错义或pLoF变异与ExWAS中的相同性状显著相关。如果GWAS通过了泛英国生物样本库项目中欧洲人群GWAS的所有质量控制步骤,包括遗传力Z分数>4,则认为该性状是可遗传的。本研究将ExWAS暗示的基因视为GWAS位点中的因果基因。这种方法不依赖于可能引入某些注释偏差的既往知识。这些位点是通过FINEMAP精细映射的。为了注释这些位点,本研究开发了FLAMES注释,这是一种用位点元数据和22种不同的SNP与基因关联方法(Table 1)来注释可信集合的方法。每个注释都获得一个分数,该分数表示可信集合中的SNP为因果SNP的联合概率以及将该SNP与基因关联的证据强度。由于可信集合中的多个SNP可以映射到一个基因,因此为每个注释创建了平均分数和最大分数。通过线性缩放分数使得最高注释分数=1,最低分数=0,从而创建了位点缩放的注释。我们保留了在精细映射的SNP具有最高后验包含概率(PIP)的750 kb范围内只有一个ExWAS暗示的基因的位点。这导致了一个包含1181个精细映射位点的数据驱动集,这些位点具有ExWAS暗示的效应基因。
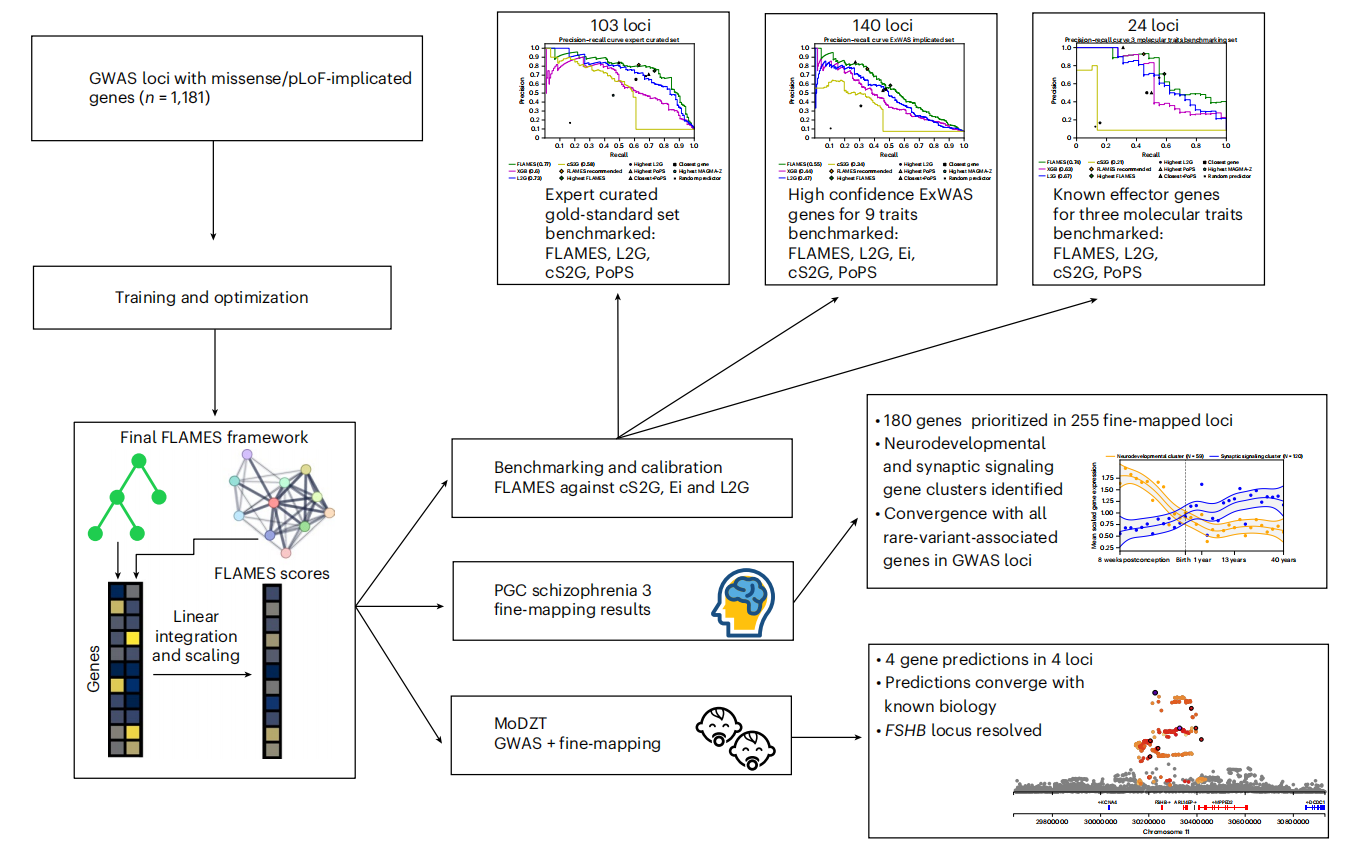 Figure 2. Overview of study design. GWAS loci (n = 1,181) are used to train and optimize a prediction framework that aims to predict the causal gene at a GWAS locus. Benchmarking and calibration are performed on three datasets that the model has not seen before. The model was then applied to a GWAS of being MoDZT and a GWAS of schizophrenia.
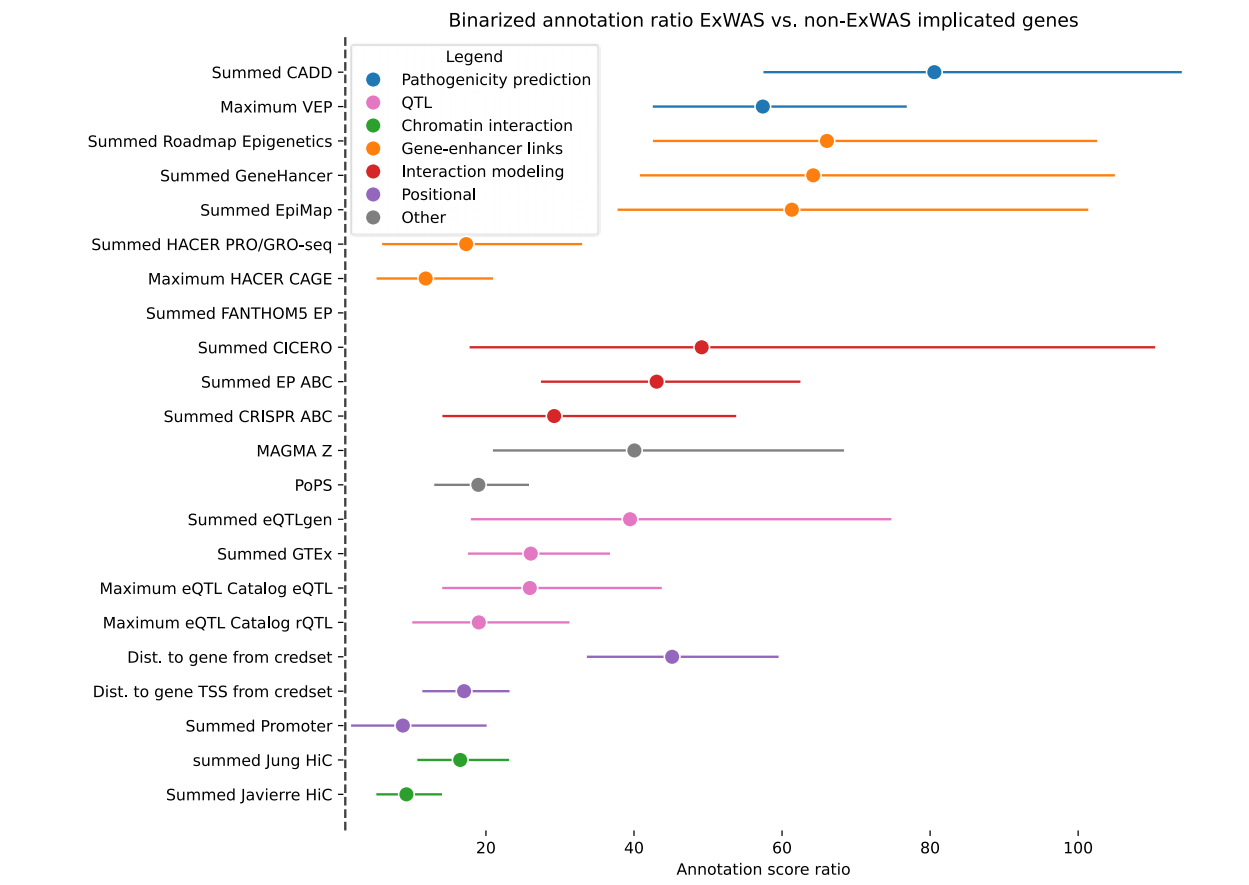
为了评估本研究的数据驱动方法是否能够捕捉到与GWAS信号相关的基因,本研究探索了FLAMES注释中包含的注释的富集情况。对于每个注释,本研究计算了ExWAS暗示的基因在位点中具有最高注释分数的比值比(odds ratio, OR),以及平均分数比。除了FANTOM5增强子-启动子相关性外,所有注释在ExWAS暗示的基因中均显著富集(Figure 3a和补充表2-4)。鉴于所有注释的OR均为正值,本研究使用留一染色体法(leave-one-chromosome-out, LOCO)在1181个注释位点上训练了22个XGBoost分类器,目的是预测位点中的效应基因。本研究使用22个LOCO模型的平均超参数在所有数据上训练了一个共识模型。本研究通过Shapley加性解释(SHAP)值(Figure 3b和Extended Data Figure 1)评估了SNP与基因注释的重要性。本研究观察到,SHAP值的整体幅度与ExWAS与非ExWAS暗示基因的OR幅度相似。总体而言,多个较弱的预测因子似乎成功整合到了一个单一模型中。随后,本研究通过在一个简单的优化框架中线性整合PoPS分数与LOCO XGBoost分数来优化预测。这导致了一个最终优化的FLAMES框架,其中原始XGBoost预测分数和位点缩放的PoPS分数被线性结合。选择收敛和基于SNP与基因的方法的线性整合是为了保持组合方法结果的可解释性。总结来说,本研究创建了一个预测模型,该模型结合了SNP与基因注释和基于收敛的证据,用于预测精细映射的GWAS位点的效应基因。
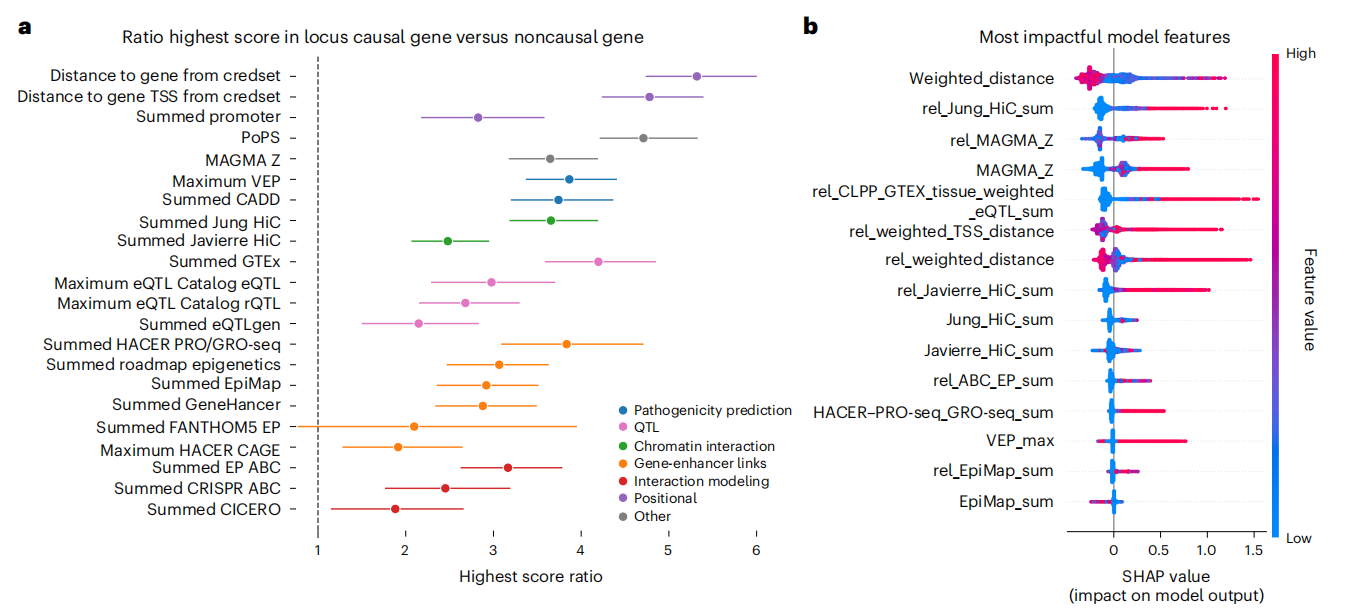
Figure 3. Predictive value of SNP-to-gene annotations. Predictive power of SNP-to-gene annotations assessed in a data-driven groundtruth set. a, OR of highest annotation score in the GWAS locus belonging to the ExWAS-implicated gene in the locus, colored by functional annotation category. Error bars, 95% CIs calculated by 1,000 times bootstrapping. b, Top feature impact (SHAP value) on effector gene prediction in XGBoost model, colored by feature value. Each feature created by FLAMES is described more thoroughly in Supplementary Table 1. Full feature impact is found in Extended Data Fig. 1.
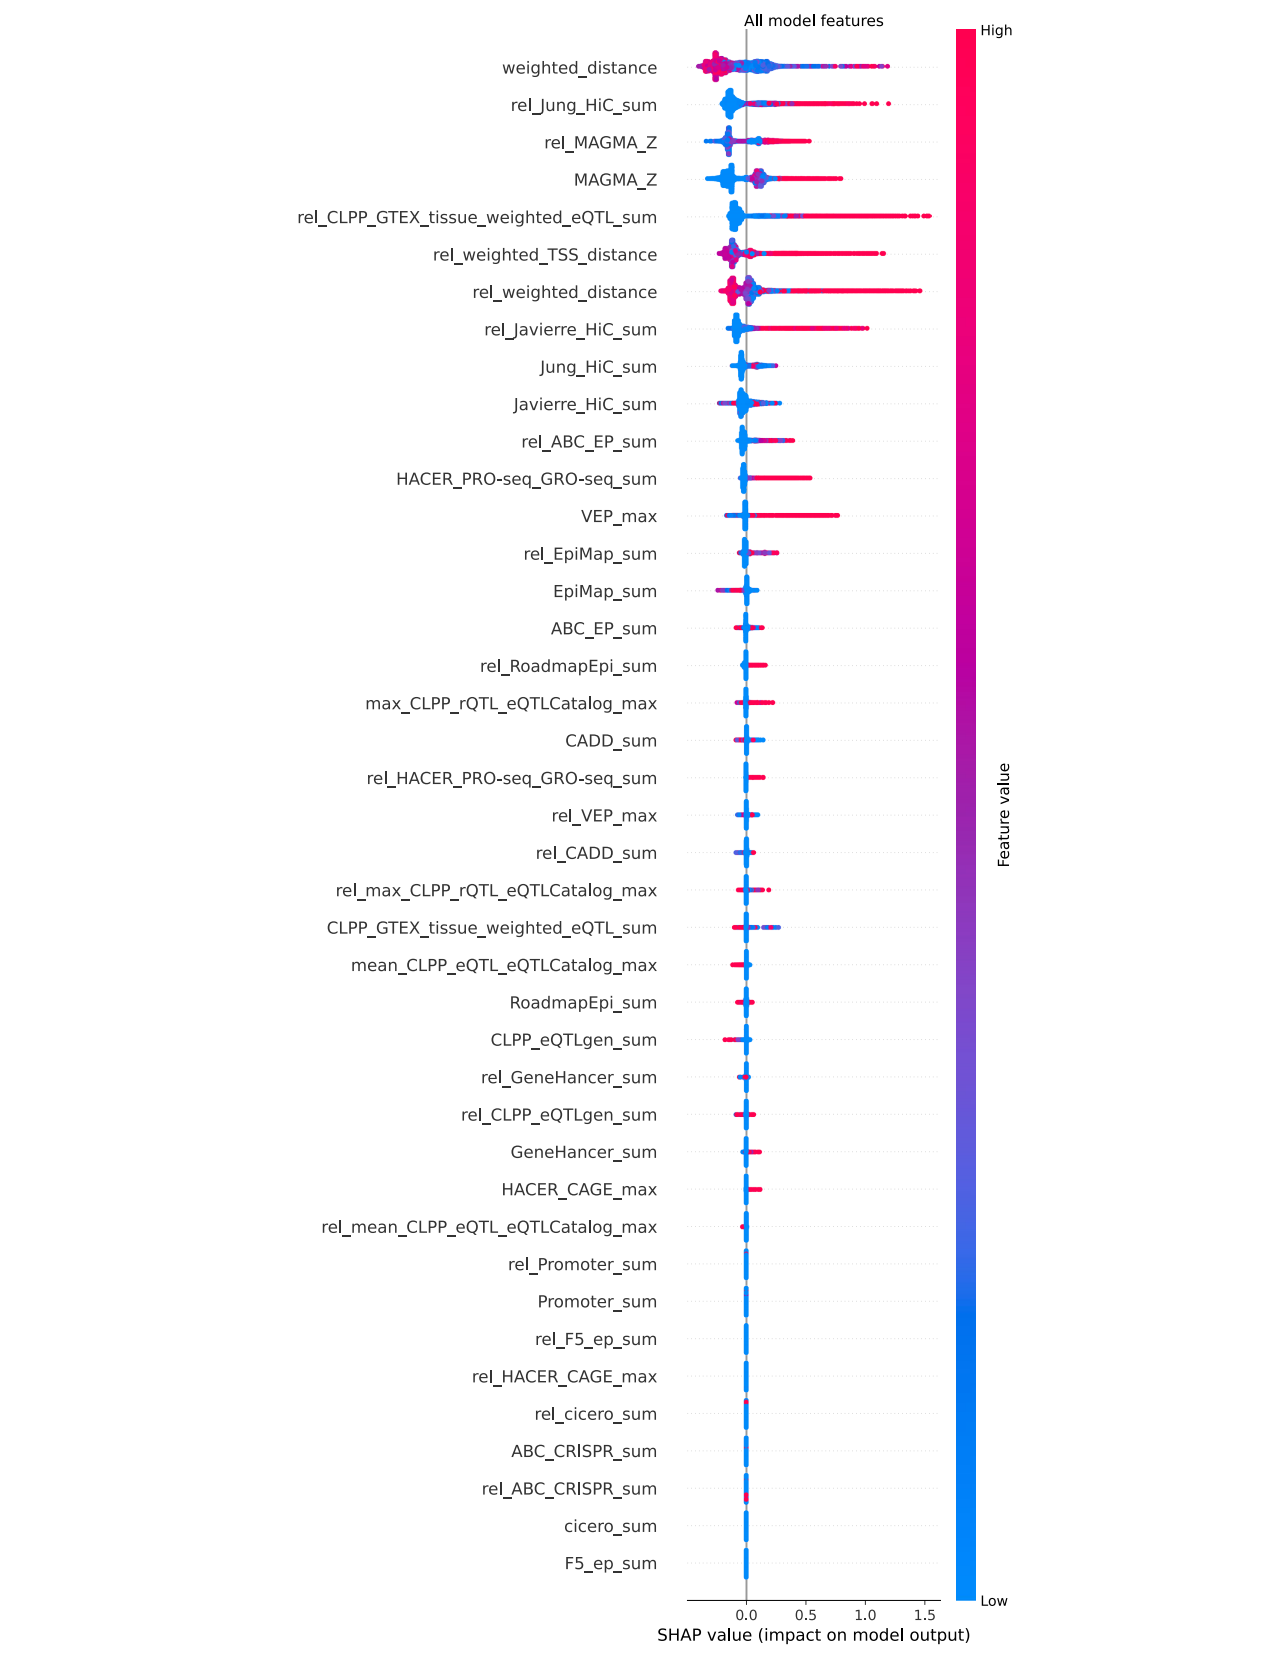
Extended Data Figure 1. Full feature impact by SHAP values. Impact of features denoted by SHAP value. Blue denotes low feature values, red denote high feature values.
本研究使用专家整理的位点–基因数据集重复分析了注释的预测价值,并将其与本研究的数据驱动的位点–基因数据集进行了比较。本研究仅包括那些具有完整GWAS汇总统计的位点。本研究观察到,在专家整理的数据集中,效应基因具有最高位点注释分数的比值比(odds ratios, ORs)显示出更强的富集(Extended Data Figure 2和Extended Data Figure 3以及补充表5和6)。这可能是由于位点–基因对的选择偏差、精细映射可信集合的纯度,或位点–基因对中真阳性与假阳性比例造成的。为了评估本研究的数据集是否包含强烈的偏差,本研究对用于训练FLAMES的1,181个位点的SNP层面和基因层面的特征进行了描述。这证实了最高基因预测的精确度在之前估计的大约22–48%的范围内,尽管偏向保守(约26%)。用于训练FLAMES的可信集合中SNP的注释富集代表了GWAS位点中的SNP(补充表7)。总体而言,注释中的富集表明,我们的数据驱动方法捕捉到了与GWAS相关的位点–基因对,避免了因专家整理可能引入的偏差。
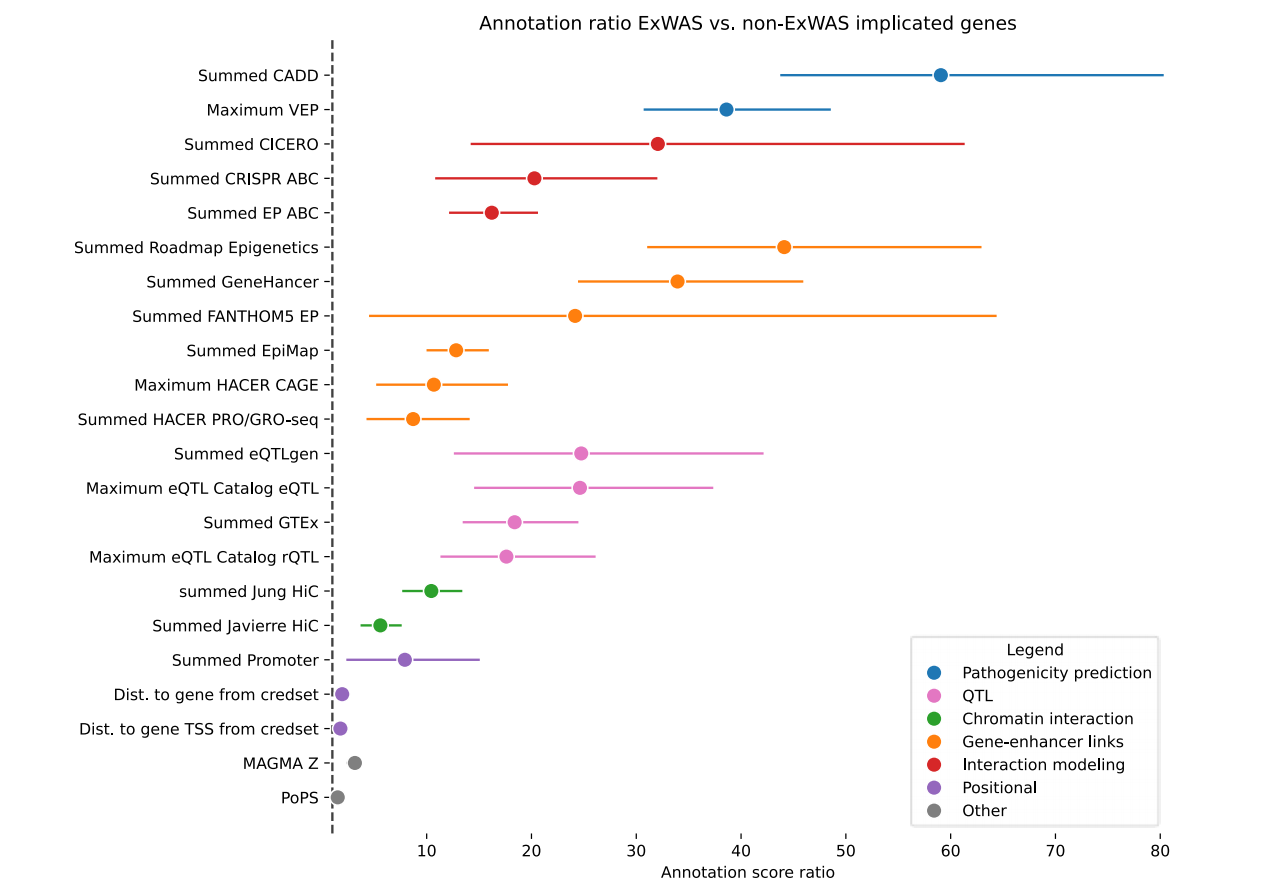
Extended Data Figure 2. Ratio of annotation scores in L2G expert-curated causal genes. Ratios of average annotation score per annotation in ExWAS implicated gene in GWAS locus versus the rest of the genes in the locus. Error bars represent 95% confidence intervals were calculated by bootstrapping 1000 times.
Extended Data Figure 3. Odds ratio of expert-curated causal gene having the highest annotation scores in the locus. Odds ratio of highest annotation score in the GWAS locus belonging to the ExWAS implicated gene in the locus versus the rest of the genes in the locus. Error bars represent 95% confidence intervals were calculated by bootstrapping 1000 times.
3.对FLAMES与最先进方法的基准测试。
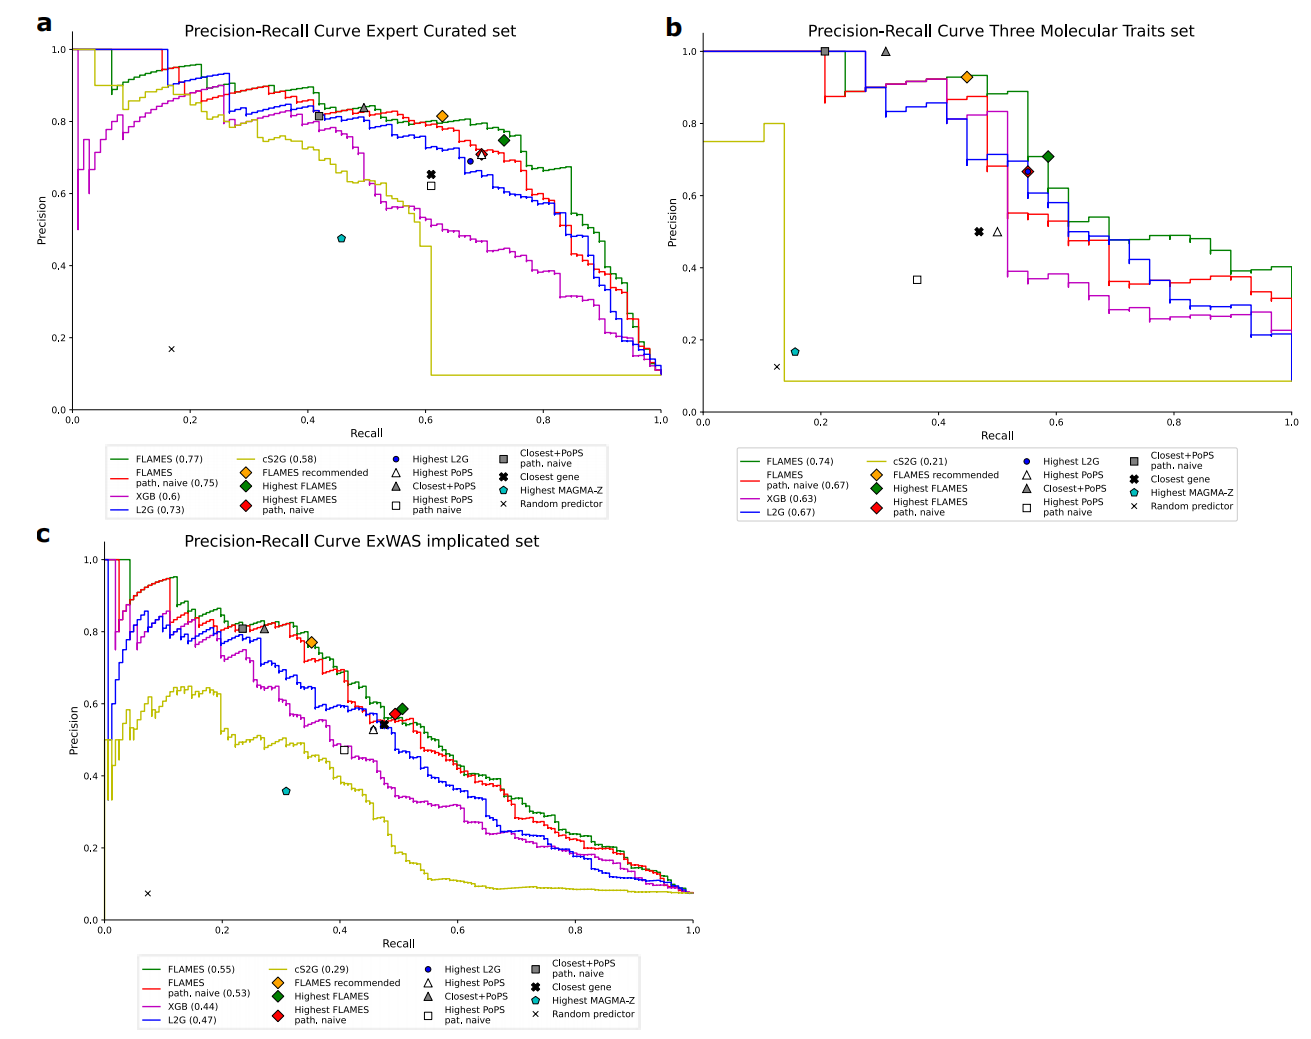
为了验证FLAMES的泛化能力,本研究在三个与训练数据不重叠的数据集上测试了FLAMES。本研究对FLAMES和其他最先进的预测方法进行了基准测试,测试数据包括:专家整理的金标准数据集、Liang等人先前确定的九种不同性状的ExWAS暗示基因集,以及三种可解释的生物性状的位点:胰岛素样生长因子1(IGF-1)、睾酮和尿酸的血清水平。使用精确率-召回率曲线下面积(AUPRC)和F1分数来评估性能。在这些基准测试中,FLAMES超越了所有其他方法(Table 2,Figure 4a-c,Extended Data Figure 4)。
本研究还使用了样本内连锁不平衡参考小组进行精细映射,允许每个位点最多有十个因果变异,并在三个分子性状上重复了基准测试(Extended Data Figure 5)。本研究展示了这种方法可以增加恢复的基因数量,与Open Targets精细映射方法相比具有优势(Figure 4b)。
为了找到一个推荐的高置信度FLAMES预测的阈值,本研究在ExWAS暗示的基准测试集中使用了原始FLAMES分数和位点FLAMES分数进行校准(补充说明)。当优先考虑所有在位点中具有最高分数、缩放后的FLAMES分数>0.248且原始FLAMES分数>0.136的基因时,本研究估计了预测基因集合的累积精确度至少为75%(Figure 4d)。优先基因的最低和中位原始FLAMES分数分别位于非优先基因原始FLAMES分数的第97百分位和第99百分位(Extended Data Figure 6)。这验证了在大多数位点中,优先级是由该基因的强证据驱动的,而不是由于其他基因缺乏证据。总体而言,我们观察到,在推荐的阈值下使用FLAMES进行基因优先级排序,其性能优于仅使用SNP与基因或基于收敛的证据的方法。
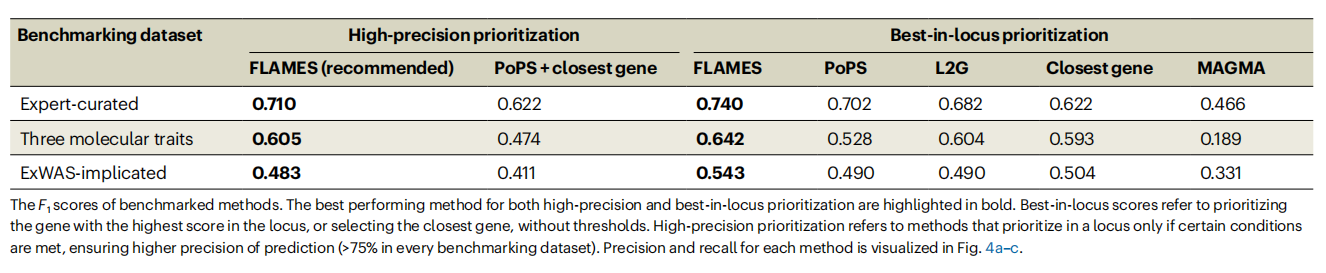
Table 2. F1 scores of prioritization methods in three different benchmarking sets
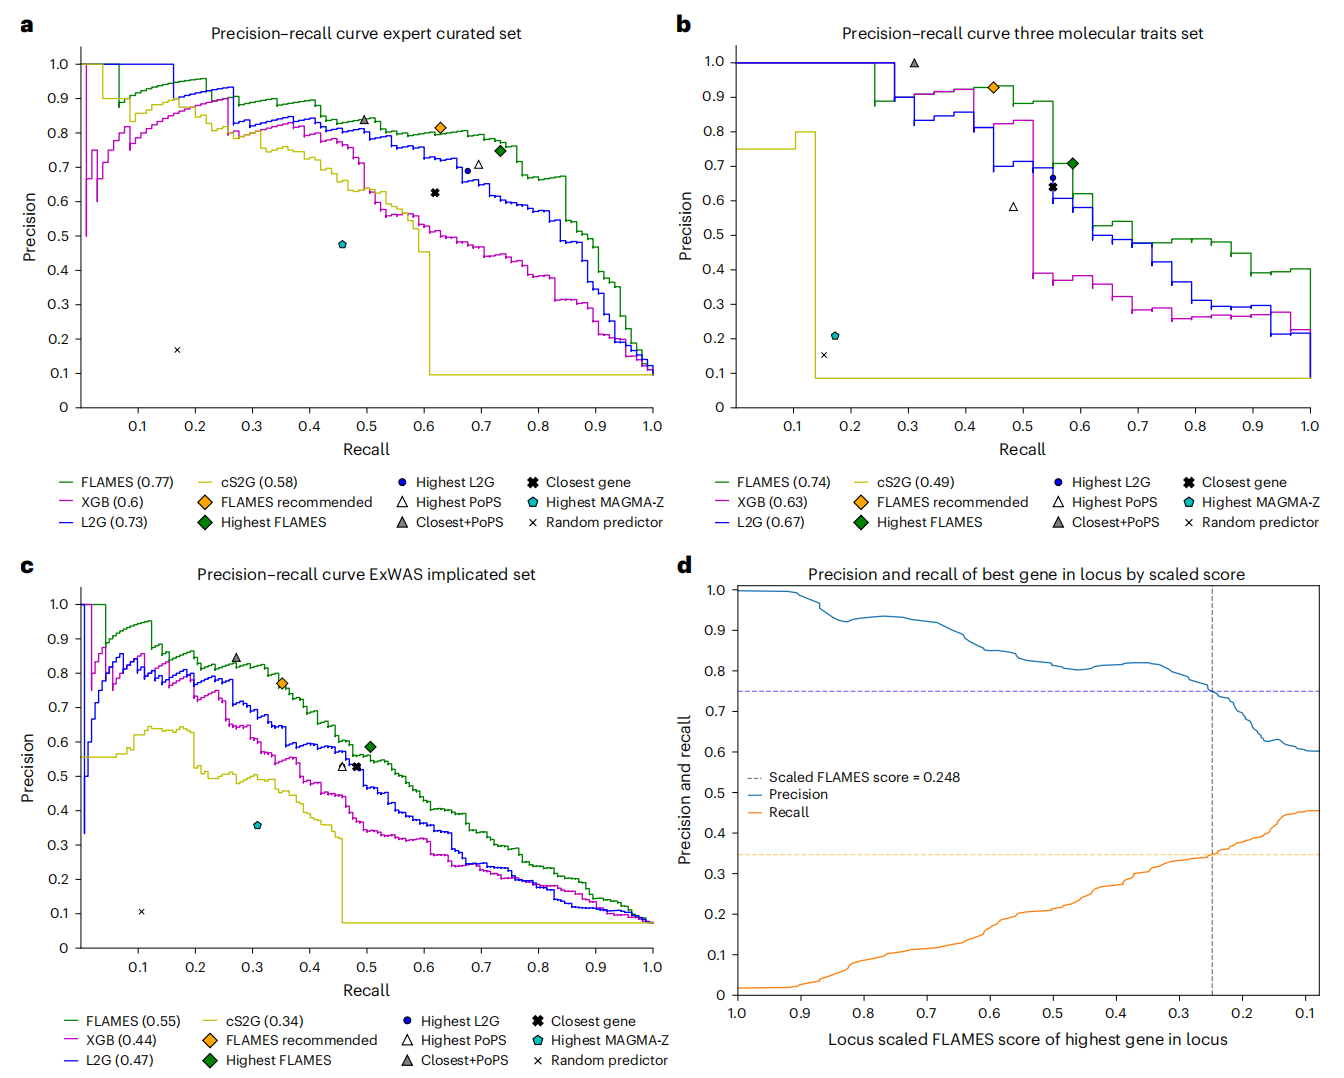
Figure 4. Benchmarking of FLAMES versus state-of-the-art tools in different datasets. Precision and recall of state-of-the-art gene prioritization methods in different benchmarking sets. Precision–recall curves of FLAMES (green line), our XGBoost model (purple line), L2G (blue line) and cS2G (yellow line) are visualized with AUPRC denoted in each legend. FLAMES recommended (orange diamond) denotes FLAMES prioritizations at our recommended threshold. Highest FLAMES (green diamond), L2G (blue circle), MAGMA (cyan pentagon) and PoPS (white triangle) represent prioritizing the gene with the highest corresponding score in the locus. Closest gene (bold black cross) denotes taking the closest gene(s) to the fine-mapped credible sets. Closest + PoPS (gray triangle) denotes prioritizing a gene if it is the closest gene and has the highest PoPS in the locus. Random predictor (black cross) represents prioritizing a random gene in the locus. a, Benchmarking on all loci–gene pairs with available GWAS summary statistics in the expert-curated dataset. b, Benchmarking of interpretable loci for GWAS of urate, IGF-1 levels and testosterone levels in blood. c, Benchmarking on high-confidence ExWAS-implicated genes in nine traits. d, Calibration 75% precision threshold score when prioritizing gene with highest scaled FLAMES scores in the locus. Smoothed precision and recall curves were created using the ExWAS-implicated gold standard set. Precision visualized in blue, recall in orange with dashed horizontal line denoting the 75% precision point and the vertical line the corresponding scaled FLAMES score.
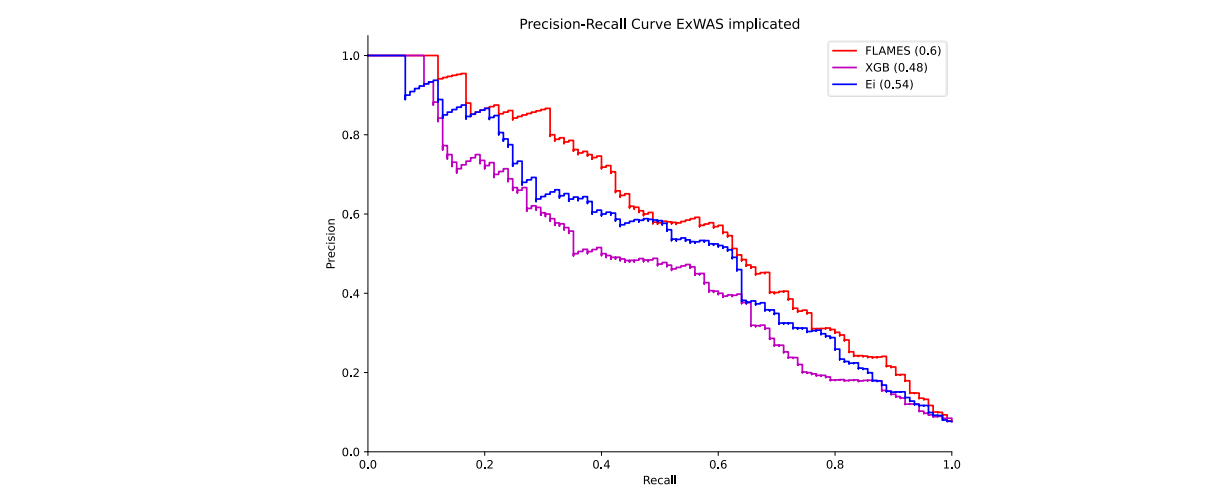
Extended Data Figure 4. Benchmark of FLAMES versus Ei. Benchmarking results of FLAMES versus Ei on the ExWAS implicated benchmarking set. Precision-recall curves of FLAMES (red line), our XGBoost model (purple line) and Ei (blue line) are visualized, with corresponding area under the precision recall curve (AUPRC) denoted in legend. For methods see Supplementary Note.
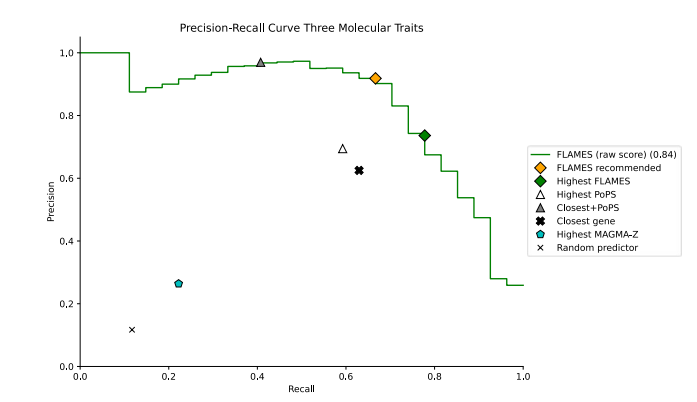
Extended Data Figure 5. Benchmark of FLAMES on three molecular traits with within-sample-LD fine-mapping. Benchmark of FLAMES in loci of three molecular traits, using fine-mapping results from within-sample finemapping6 . Precision recall curves of FLAMES raw score (green line), with corresponding area under the precision-recall curve (AUPRC) denoted in legend. FLAMES recommended (orange diamond) denotes FLAMES prioritizations at our recommended threshold. Highest FLAMES (green diamond), MAGMA (cyan pentagon) and PoPS (white triangle) represent prioritizing the gene with the highest corresponding score in the locus. Closest gene (bold black cross) denotes taking the closest gene(s) to the fine-mapped credible sets. Closest + PoPS (grey triangle) denotes prioritizing a gene if it is the closest gene and has the highest PoPS score in the locus. Random predictor (black cross) represents prioritizing a random gene in the locus. FLAMES is scored using the more conservative raw FLAMES score due to multiple signals present per locus (see Supplementary Note).
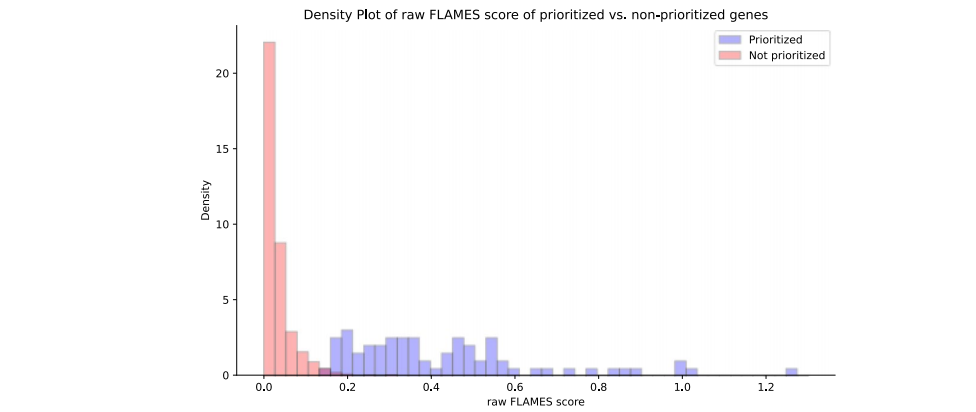
Extended Data Figure 6. Raw FLAMES score of prioritized vs non-prioritized genes. Scores were derived from ExWAS implicated benchmarking set. Prioritized genes in blue, not prioritized in red. To prioritize genes we used the recommended FLAMES threshold.
4.FLAMES在双胞胎GWAS位点中的应用
本研究将FLAMES应用于最近完成的一项关于双胞胎母亲(MoDZT)的GWAS研究。使用FUMA定义位点,共确定了五个不同的位点。本研究使用FINEMAP对这些位点进行精细映射,并限制每个位点只有一个因果SNP。为了保持一致性,鉴于原始研究报道了本研究FUMA定义的两个位点的合并版本,本研究只保留了包含最大贝叶斯因子可信集合的位点。本研究优先考虑缩放后的FLAMES分数大于0.248且原始FLAMES分数大于0.136的基因。在四个不同的位点中,FLAMES优先考虑了GNRH1、FSHB、SMAD3和ZFPM1(补充表8a,b)。使用最近的基因和最高的PoPS方法会优先考虑FSHB、SMAD3和ZFPM1,但不会优先考虑GNRH1。尽管有大量的SNP与基因数据表明DOCK5是该位点的因果基因,但GNRH1被预测为其位点的效应基因。鉴于GNRH1在调节促卵泡激素、黄体生成素和生育能力方面的作用,它是最可能的因果基因,而DOCK5编码的是一种主要与破骨细胞和骨密度相关的细胞内信号蛋白。XGBoost对GNRH1的优先考虑高于DOCK5,突出了模型对包含在模型中的不同注释给予了适当的权重(Extended Data Figure 7)。尽管在牛中的证据表明SMAD6可能是责任基因,SMAD3基因之前已被认为与MoDZT有关。FLAMES为SMAD3提供了强烈的功能证据和基于收敛的证据。而SMAD6几乎没有基于收敛的证据,且精细映射的SNP与SMAD6之间的距离太大,无法用任何SNP与基因数据对SMAD6进行注释。FSHB的优先级与该性状的预期生物学基础一致,但值得注意的是,有大量的SNP与基因证据将精细映射的SNP与ARL14EP联系起来(补充表8d)。尽管XGB模型为ARL14EP分配了高分,但在位点中FSHB是接近第二高的(Figure 5b)。结合基于收敛的分数,FSHB的FLAMES分数高于ARL14EP,当应用推荐的阈值时,FSHB被优先考虑。这些结果突出了FLAMES框架如何正确权衡基于SNP与基因和基于收敛的证据,以解决复杂的位点。
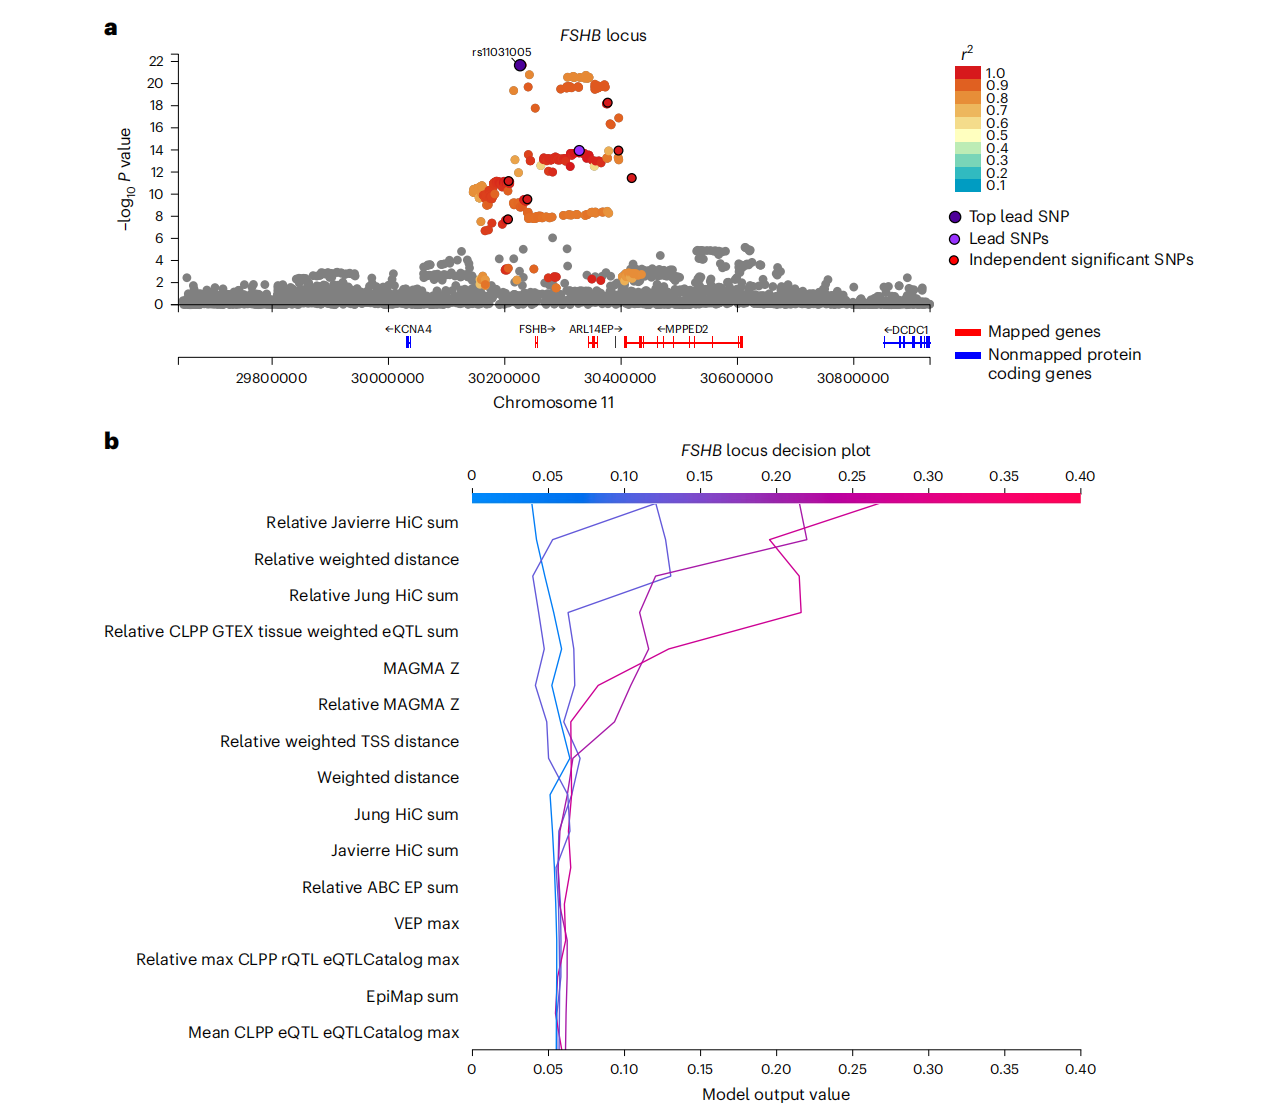
Figure 5. FLAMES mapped genes of the twinning FSHB locus. a, Locus plot showing variants associated with twinning. P values of the t-statistic are −log10 transformed (genome-wide significance = P < 5 × 10⁻⁸). Plot shows only genes mapped by FLAMES to the credible set. The two SNPs with PIP > 0.1 are indicated by rsID of lead SNP and do not separate visually by genomic distance on this scale. Lead SNP and fine-mapping centroid are closest to FSHB although most significant variants within a gene body map to ARL14EP. b, Decision plot showing the annotations driving the prediction for ARL14EP in the FSHB locus; x axis values correspond to raw XGB scores.
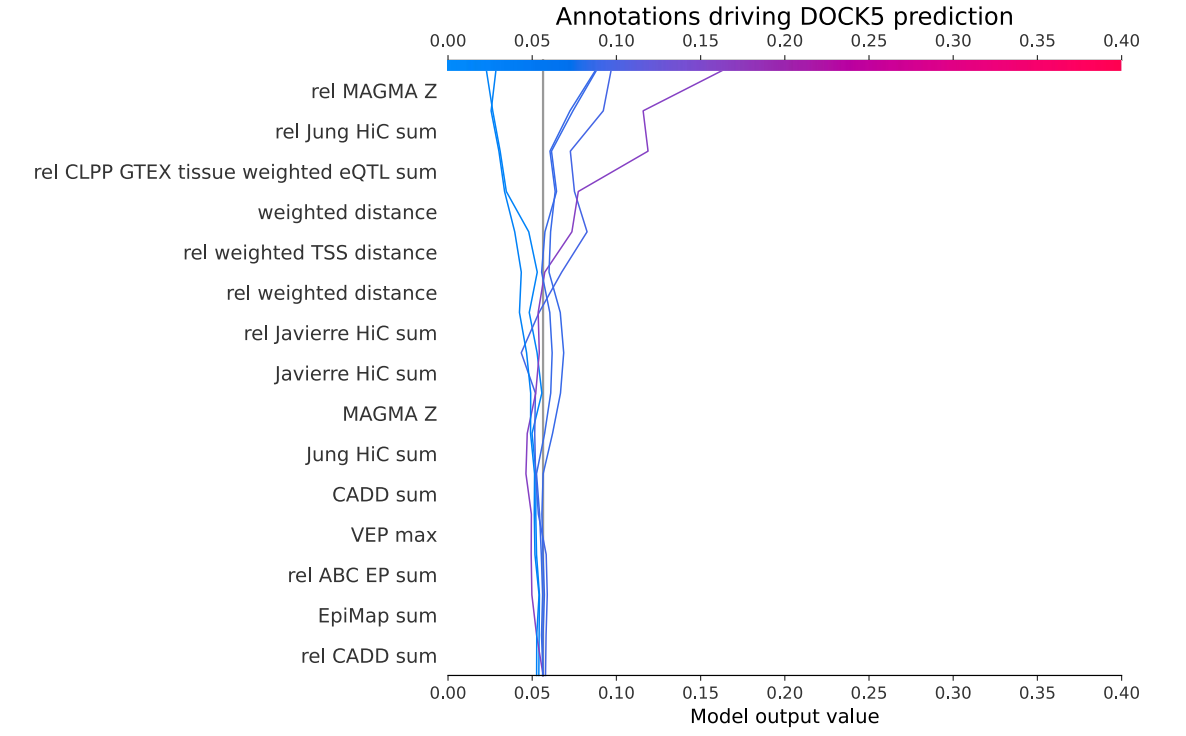
Extended Data Figure 7. Decision plot of DOCK5 locus. Decision plot of FLAMES XGB scores of DOCK5 locus highlighting that DOCK5 is prioritized mostly due to high MAGMA Z-scores, distance and eQTL evidence.
5.FLAMES在精神分裂症基因预测中的应用
本研究使用FLAMES来预测最近一次精神分裂症荟萃分析的精细映射结果中的效应基因。本研究通过FLAMES对750 kb范围内的可信集合中心点的基因进行预测,使用推荐的FLAMES分数阈值(缩放后的FLAMES分数大于0.248和原始FLAMES分数大于0.136),共预测了180个独特的基因(补充表9)。在这些180个基因中,有50个被SYNGO映射到突触过程(补充表10)。精神病遗传学联合会(PGC)的原始精神分裂症GWAS出版物基于相同的精细映射数据,使用了一种定制的优先级策略,该策略专门针对影响中枢神经系统的疾病的危险基因预测,共优先考虑了106个基因(补充表11)。在这些106个基因中,有21个被SYNGO映射为突触基因(补充表12)。FLAMES在255个精细映射的精神分裂症相关位点中显著增加了危险基因的鉴定(P < 2.67 × 10⁻¹¹,单侧Fisher精确检验),同时优先考虑了与表型相关的突触基因的相似或更大的比例(OR = 1.55;95% CI [0.87, 2.77])。鉴于本研究预期疾病风险和保护效应的很大一部分将通过突触生物学介导,而PGC的优先级策略是针对中枢神经系统疾病的,这表明FLAMES预测能够像专家指导的定制方法一样准确地考虑基因的生物学背景。这些发现表明,与特定性状的优先级方法相比,FLAMES预测能够恢复更多的疾病相关生物学信息,并提供了一条更简单、更快捷的高置信度危险基因路径。
对FLAMES优先级排序的基因进行通路分析可能会增加假阳性,因为这些通路在FLAMES使用的PoPS特征中存在,这会引入循环性。因此,本研究重新运行了FLAMES,使用了由所有非通路特征生成的PoPS(补充表13)。与包含通路信息的FLAMES相比,不依赖通路的FLAMES仅表现出轻微的性能下降(Extended Data Figure 8)。在逻辑回归框架中,本研究对178个不依赖通路的FLAMES优先级排序基因进行了SYNGO和MSigDB基因本体(GO)富集分析,测试了在高脑表达基因条件下基因集的富集情况。本研究发现,FLAMES优先级排序基因与突触前和突触后位置存在关联(Figure 6a)。值得注意的是,本研究发现在调节膜后电位、化学突触传递的突触后调节以及突触粘附方面存在显著富集(Figure 6b,补充表14和15)。突触粘附在使用SYNGO基因集进行MAGMA基因集分析时未被发现与精神分裂症相关,且在对PGC定义的风险基因集进行SYNGO分析时也不显著(补充表17),这突出了高质量因果基因预测对于基因集富集分析的益处。
为了深入了解FLAMES预测的精神分裂症风险基因的功能,本研究提取了这些基因在31个不同发育时间点的皮质脑区的表达水平,类似于van der Meer等人的研究。通过K均值聚类分析,本研究寻找在整个生命周期中表现相似的基因共表达聚类。轮廓分数分析显示,数据中最佳的聚类数量为两个(补充表18和19)。本研究通过广义加性模型推测了整个生命周期的表达曲线,观察到这两个聚类具有不同的时间表达曲线,大约在出生时相交,证实了之前的研究结果(Figure 6c)。这表明这两个精神分裂症风险基因聚类在产前和产后发挥不同的作用。我们发现,对所有脑表达基因进行反复聚类分析也得出两个聚类作为表达数据的最佳分离,且这两个聚类的表达模式与精神分裂症聚类相似(Extended Data Figure 9)。这表明这些表达模式并非精神分裂症所独有,而是精神分裂症基因的表达模式可以细分为两个主要的脑表达程序。
为了识别每个独立聚类的生物学功能,本研究在回归框架内对每个聚类中的基因进行了SYNGO和MSigDB基因本体(GO)分析,条件是脑表达基因(补充表19-22)。产前高表达的聚类显著富集在突触粘附和几个神经发育基因集中,如神经元生成、神经发生、纹状体发育和下Pallium发育。产后高表达的聚类显著富集在突触信号和离子通道相关通路。本研究通过将每个皮质区域的平均标准化基因表达值投影到三维磁共振成像Brodmann图谱上,可视化了每个聚类在最早和最晚测量时间点的基因表达。两个聚类之间的平均皮质表达在受孕后8周和40岁时显著不同(P < 1 × 10⁻⁶,Mann-Whitney U 检验)。观察到的表达增加通常是全皮质的,而不是强烈区域特异性的(Figure 6c)。总体而言,本研究发现约三分之一的精神分裂症风险基因在产前全皮质中活跃,主要具有神经发育功能,而剩余的精神分裂症风险基因在出生后全皮质中活跃,并且在与突触信号相关的功能中显著富集。
最后,本研究发现FLAMES优先级排序的基因包括GRIN2A、SP4、STAG1和FAM120A,这些基因在罕见变异分析中被发现与精神分裂症相关。PGC优先级排序的基因包括GRIN2A和SP4,但FAM120A和STAG1未达到优先级排序的阈值(补充表 23)。这表明FLAMES在寻找精神分裂症风险基因的罕见和常见信号的汇聚方面表现更好。特别是,FLAMES将突触粘附确定为精神分裂症遗传风险负担的关键机制,这一发现之前未从GWAS结果中报告。FLAMES优先级排序的突触基因和ExWAS暗示基因的比例与PGC方法相似,表明召回率的增加并未伴随着精确度的降低。这表明FLAMES优先级排序的基因与疾病相关。
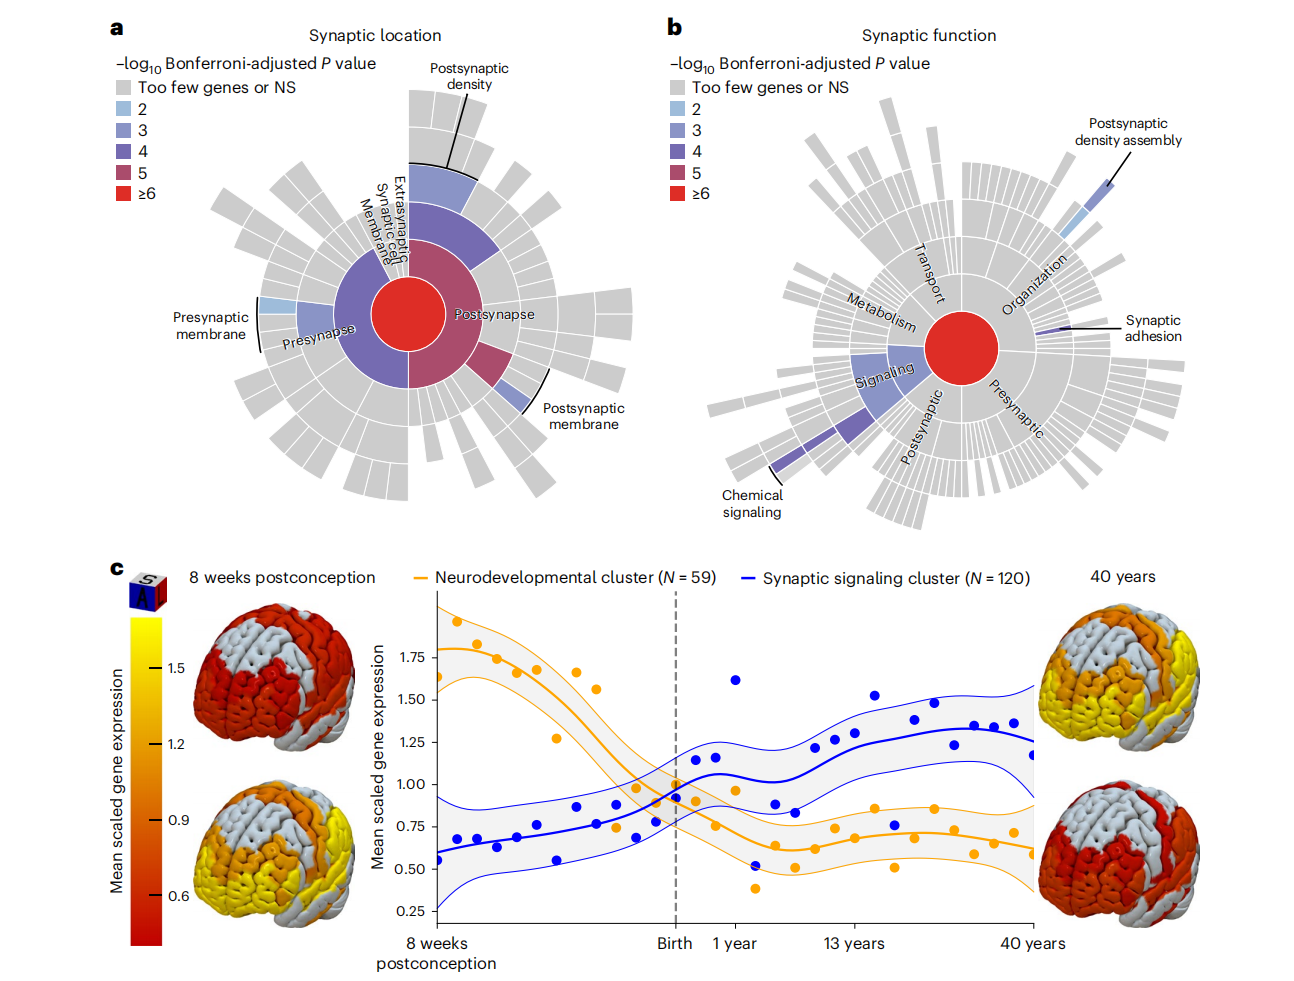
Figure 6. Functionality and temporal expression patterns of schizophrenia risk genes. a,b, SYNGO sunburst plot of synaptic cellular location (a) and biological process GO terms (b). P values of Wald test denote FLAMES genes predicting pathway membership, conditional on brain-expressed genes, in a logistic regression framework (Methods). Reported P values are −log10 transformed and Bonferroni-corrected for multiple testing. All significant GO terms are color coded based on their significance bin, meaning that the −log10 transformed P value is greater than or equal to the bin value. NS, nonsignificant. c, Expression of mean scaled schizophrenia risk gene coexpression clusters throughout lifespan. Clusters were formed using k-means clustering on gene expression levels of schizophrenia risk genes in cortical tissue of 31 donors throughout their lifespan. Datapoints represent the average value of the mean scaled expression values of all genes in the corresponding cluster at that timepoint. Trajectories of clusters are extrapolated from the average values per timepoint using generalized additive modeling and visualized as blue and orange lines ± 95% CIs in gray. Average mean scaled gene expression per cluster per region at the earliest and latest available timepoint is visualized for each cluster in the brain-heatmap; gray areas represent brain regions without expression data available. Top left and bottom right brains show expression of genes in neurodevelopmental cluster at 8 weeks postconception and 40 years old, respectively. Bottom left and top right brains show expression of genes in synaptic signaling cluster at 8 weeks postconception and 40 years old, respectively; 3D orientation visualized in the gray-blue-red (superior (S), anterior (A), lateral (L)) box in the top left hand of the figure. N, number of genes in each cluster.
Extended Data Figure 8. Benchmarking results when including pathway naïve FLAMES. Precision and recall of state-of-the-art gene prioritization methods in different benchmarking sets. Precision recall curves of FLAMES (green line), FLAMES scores using PoPS scores generated excluding pathway information (red line), our XGBoost model (purple line), L2G (blue line) and cS2G (yellow line) are visualized, with corresponding area under the precision-recall curve (AUPRC) denoted in legend. FLAMES recommended (orange diamond) denotes FLAMES prioritizations at our recommended threshold. Highest FLAMES (green diamond), L2G (blue circle), MAGMA (cyan pentagon) and PoPS (white triangle) represent prioritizing the gene with the highest corresponding score in the locus. Closest gene (bold black cross) denotes taking the closest gene(s) to the fine-mapped credible sets. Closest + PoPS (grey triangle) denotes prioritizing a gene if it is the closest gene and has the highest PoPS score in the locus. Random predictor (black cross) represents prioritizing a random gene in the locus. a, Benchmarking on all loci-gene pairs with available GWAS summary statistics in the expert-curated dataset. b, Benchmarking of interpretable loci for GWAS of urate, IGF-1 levels and testosterone levels in blood. c, Benchmarking on high confidence ExWAS implicated genes in nine traits.
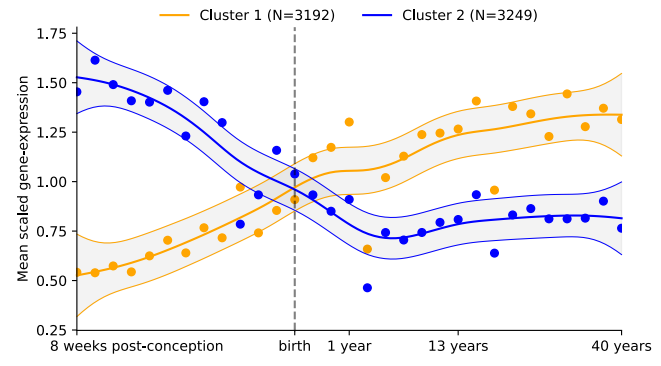
Extended Data Figure 9. Brain expressed genes expression profile in BRAINSPAN. Expression profile of BRAINSPAN brain expressed genes after k-means clustering. Gene expression is mean scaled per gene, and averaged across all genes in the cluster per timepoint. The expression of the two separate clusters is represented in orange and blue ± 95% confidence intervals in grey

汇报人:舒涛
审核:吴桂儀、任建君
